
ご注意下さい
この記事は3年以上前に書かれた記事ですので、内容が古い可能性があります。
Apacheのチューニングにはいくつかありますが、運用するサイトの性質やアクセスの傾向を見ながらチューニングしていく必要があります。
今回は
- preforkかworkerか
- KeepAliveの設定はすべきか?
といった観点で見てみます。
preforkかworkerか
CentOSにバンドルされているApacheではマルチプロセスのpreforkと、マルチプロセス+マルチスレッドのworkerとマルチスレッドのeventを選択することができます。
ただ、eventはApache/2.4からの正式サポートなので、まだ不安定なところもありそうです。デフォルトはpreforkで子プロセスをforkしてリクエストを処理する形態です。子プロセスを作るということは自分のコピーを作ることになるのでメモリの使用量という面で不利になります。
自宅のサーバのWebサーバが時々原因不明でハングする事象があったのですが、preforkだったこととメモリサイズ(1GB)だったことでハングしたのでは…と思ってます。
第2回 性能検証!速いのはどっち? | Think IT
第2回 性能検証!速いのはどっち? ...

上記サイトの検証結果からはworkerの方がpreforkよりもパフォーマンスがいい(単位時間当たりの処理リクエスト量が多い)ことからworkerの設定にしたいと思います。
workerにするとスレッドを起動することになるのですが、mod_phpがスレッドセーフ(スレッドアンセーフ)でないためwordpressを使っている場合はprefork一択だよ、という記事があるのですが、最近のPHPはスレッドセーフになっているようでwordpressはちゃんと動作します。
では早速workerでの起動方法ですが、/usr/sbin配下には実はそれぞれの起動形態用にバイナリファイルが置いてあります。
# ls -al httpd*
-rwxr-xr-x 1 root root 319380 10月 17 01:27 httpd
-rwxr-xr-x 1 root root 331804 10月 17 01:27 httpd.event
-rwxr-xr-x 1 root root 331804 10月 17 01:27 httpd.worker
httpdがprefork用、httpd.worker用がworker用、httpd.eventがevent用になります。httpdの代わりにhttpd.workerを起動すれば良いわけですが、/etc/sysconfig/httpdファイルの編集をします。
#
# The default processing model (MPM) is the process-based
# 'prefork' model.  A thread-based model, 'worker', is also
# available, but does not work with some modules (such as PHP).
# The service must be stopped before changing this variable.
#
HTTPD=/usr/sbin/httpd.worker
ファイルを編集して再起動すればworkerモードで起動するはずです。簡単ですね。
次にphpがちゃんと動くか調べる必要があります。
以下の内容のファイルをwebサーバに配置し、叩いてみます。(例えばinfo.phpとしてhttps://blog.kamata-net.com/info.phpを叩きます)
<?php info(); ?>
すると以下の結果が表示されるのですが、
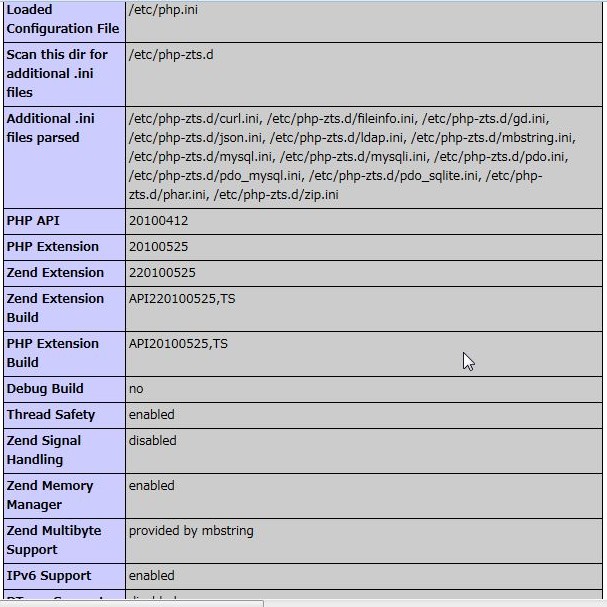
Thread Safty欄がEnableになっていれば問題ありません。このように調べるより自分のサイトがちゃんと表示されるか確認した方が早いかも…。
さて、ここからもう少しチューニングしていきます。Apacheにどれぐらいのメモリの割当を許可するか、若干適当ですが計算をして割当量を決めていきます。
現在のメモリの使用量と、apacheのプロセスがどれぐらいのメモリを使っているのか確認します。
total used free shared buffers cached
Mem: 2074972 300788 1774184 0 6780 43540
-/+ buffers/cache: 250468 1824504
Swap: 1048568 5972 1042596
#
# ps aux | grep [h]ttpd | grep [a]pache | awk 'BEGIN{x=0}{x+=$6}END{ print x/NR }'
704048
サーバには2GBのメモリを積んでおり、現在は300MB使ってますので1.7GBの空きがあるようです。
httpd 1プロセス当たりのメモリ使用量は70MB程度。
つまり1700 / 70 = 24.28となりますのでプロセス起動の上限は24。余裕を見て20(ServerLimit)とします。
MaxClients(総スレッド数) / ThreadsPerChild(1子プロセスが生成するスレッド数) = 最大サーバプロセス数(ServerLimit)
なので、MaxClients = 20 x 25 = 500
スクリプト系はメモリリークが多いという話もあるようですので、MaxRequestsPerChildを設定して一定リクエストを処理し終わったところでメモリの開放も含めてプロセスの終了を行います。
 # worker MPM
# StartServers: initial number of server processes to start
# MaxClients: maximum number of simultaneous client connections
# MinSpareThreads: minimum number of worker threads which are kept spare
# MaxSpareThreads: maximum number of worker threads which are kept spare
# ThreadsPerChild: constant number of worker threads in each server process
# MaxRequestsPerChild: maximum number of requests a server process serves
<IfModule worker.c>
ServerLimit         20
StartServers         2
MaxClients         500
MinSpareThreads     25
MaxSpareThreads     75
ThreadsPerChild     25
MaxRequestsPerChild  1000
</IfModule>
apache benchで早速負荷テストをしてみます。10多重で100回負荷をかけてみますのでトータル1000リクエスト投げる計算です。
まずはpreforkの場合
This is ApacheBench, Version 2.0.40-dev <$Revision: 1.146 $> apache-2.0
Copyright 1996 Adam Twiss, Zeus Technology Ltd, http://www.zeustech.net/
Copyright 2006 The Apache Software Foundation, http://www.apache.org/
Benchmarking blog.kamata-net.com (be patient).....done
Server Software: Apache/2.2.3
Server Hostname: blog.kamata-net.com
Server Port: 80
Document Path: /
Document Length: 79199 bytes
Concurrency Level: 10
Time taken for tests: 58.354977 seconds
Complete requests: 100
Failed requests: 13
(Connect: 0, Length: 13, Exceptions: 0)
Write errors: 0
Total transferred: 7957887 bytes
HTML transferred: 7919887 bytes
Requests per second: 1.71 [#/sec] (mean)
Time per request: 5835.498 [ms] (mean)
Time per request: 583.550 [ms] (mean, across all concurrent requests)
Transfer rate: 133.17 [Kbytes/sec] received
Connection Times (ms)
min mean[+/-sd] median max
Connect: 0 0 0.1 0 1
Processing: 2255 5668 1551.5 5475 13746
Waiting: 2161 5556 1551.2 5391 13701
Total: 2255 5668 1551.5 5475 13746
Percentage of the requests served within a certain time (ms)
50% 5475
66% 5887
75% 6261
80% 6570
90% 7159
95% 8445
98% 10203
99% 13746
100% 13746 (longest request)
次にworker。
This is ApacheBench, Version 2.0.40-dev <$Revision: 1.146 $> apache-2.0
Copyright 1996 Adam Twiss, Zeus Technology Ltd, http://www.zeustech.net/
Copyright 2006 The Apache Software Foundation, http://www.apache.org/
Benchmarking blog.kamata-net.com (be patient).....done
Server Software: Apache/2.2.3
Server Hostname: blog.kamata-net.com
Server Port: 80
Document Path: /
Document Length: 79199 bytes
Concurrency Level: 10
Time taken for tests: 79.942566 seconds
Complete requests: 100
Failed requests: 38
(Connect: 0, Length: 38, Exceptions: 0)
Write errors: 0
Total transferred: 7957922 bytes
HTML transferred: 7919922 bytes
Requests per second: 1.25 [#/sec] (mean)
Time per request: 7994.257 [ms] (mean)
Time per request: 799.426 [ms] (mean, across all concurrent requests)
Transfer rate: 97.21 [Kbytes/sec] received
Connection Times (ms)
min mean[+/-sd] median max
Connect: 0 1 4.6 0 16
Processing: 1691 7742 5848.6 6043 27691
Waiting: 1645 7667 5854.1 5998 27640
Total: 1691 7743 5848.7 6058 27691
Percentage of the requests served within a certain time (ms)
50% 6058
66% 10890
75% 11556
80% 12184
90% 13891
95% 21537
98% 26283
99% 27691
100% 27691 (longest request)
あれ?preforkの方が性能がいい…(汗)
100多重の場合はどうでしょうか?
This is ApacheBench, Version 2.0.40-dev <$Revision: 1.146 $> apache-2.0
Copyright 1996 Adam Twiss, Zeus Technology Ltd, http://www.zeustech.net/
Copyright 2006 The Apache Software Foundation, http://www.apache.org/
Benchmarking blog.kamata-net.com (be patient).....done
Server Software: Apache/2.2.3
Server Hostname: blog.kamata-net.com
Server Port: 80
Document Path: /
Document Length: 79200 bytes
Concurrency Level: 100
Time taken for tests: 91.391204 seconds
Complete requests: 100
Failed requests: 9
(Connect: 0, Length: 9, Exceptions: 0)
Write errors: 0
Total transferred: 7957990 bytes
HTML transferred: 7919990 bytes
Requests per second: 1.09 [#/sec] (mean)
Time per request: 91391.205 [ms] (mean)
Time per request: 913.912 [ms] (mean, across all concurrent requests)
Transfer rate: 85.03 [Kbytes/sec] received
Connection Times (ms)
min mean[+/-sd] median max
Connect: 0 3 2.7 4 9
Processing: 22082 56733 20954.7 53844 91385
Waiting: 21930 56604 20974.0 53402 91319
Total: 22086 56737 20955.1 53849 91386
Percentage of the requests served within a certain time (ms)
50% 53849
66% 63270
75% 79957
80% 82330
90% 86052
95% 87835
98% 89416
99% 91386
100% 91386 (longest request)
#
下がprefork。
This is ApacheBench, Version 2.0.40-dev <$Revision: 1.146 $> apache-2.0
Copyright 1996 Adam Twiss, Zeus Technology Ltd, http://www.zeustech.net/
Copyright 2006 The Apache Software Foundation, http://www.apache.org/
Benchmarking blog.kamata-net.com (be patient).....done
Server Software: Apache/2.2.3
Server Hostname: blog.kamata-net.com
Server Port: 80
Document Path: /
Document Length: 79199 bytes
Concurrency Level: 100
Time taken for tests: 56.975387 seconds
Complete requests: 100
Failed requests: 65
(Connect: 0, Length: 65, Exceptions: 0)
Write errors: 0
Total transferred: 7957951 bytes
HTML transferred: 7919951 bytes
Requests per second: 1.76 [#/sec] (mean)
Time per request: 56975.388 [ms] (mean)
Time per request: 569.754 [ms] (mean, across all concurrent requests)
Transfer rate: 136.39 [Kbytes/sec] received
Connection Times (ms)
min mean[+/-sd] median max
Connect: 0 5 2.4 6 9
Processing: 2910 32790 16244.6 33334 56966
Waiting: 2882 32537 16290.1 32586 56935
Total: 2910 32795 16246.6 33340 56974
Percentage of the requests served within a certain time (ms)
50% 33340
66% 44185
75% 47522
80% 50732
90% 54182
95% 55452
98% 56809
99% 56974
100% 56974 (longest request)
#
確かにpreforkの方が早く終わるんですが、負荷テスト中にブラウザから参照しようとしても全く何も読み込んでくれなかったのに対して、workerはabの結果はあまりよくないですが、負荷テスト中のブラウジングには遅いながらも応答を返してくれてました。ということでせっかく設定もしたんだししばらくworkerを使ってみようと思います。
KeepAliveについて
アクセスログを見てみると1ページにつき30~50リクエストが飛んでいるようです。
KeepAliveがOFFの場合このリクエストごとにTCPのセッションを張り行くのでリソースの無駄です。
KeepAliveをONにすることで同一セッションで複数のリクエストを処理するので効率的です。またタイムアウトもデフォルトだと15秒も待つ設定になっていますのでもっともっと短くしてしまいましょう。
KeepAlive On

#
# MaxKeepAliveRequests: The maximum number of requests to allow
# during a persistent connection. Set to 0 to allow an unlimited amount.
# We recommend you leave this number high, for maximum performance.
#
MaxKeepAliveRequests 100

#
# KeepAliveTimeout: Number of seconds to wait for the next request from the
# same client on the same connection.
#
#KeepAliveTimeout 15
KeepAliveTimeout 2
ファイルディスクリプタの拡張
せっかくいろいろチューニングしたのに結局FDが足りなくて1024以上のリクエストを受けれなかった、という話もありますね。
ファイルディスクリプタの拡張はlimits.confを書換えただけでは変わりませんので注意が必要です。apacheのスタートアップスクリプトに直接書くことをオススメします。
# The semantics of these two functions differ from the way apachectl does
# things -- attempting to start while running is a failure, and shutdown
# when not running is also a failure.  So we just do it the way init scripts
# are expected to behave here.
start() {
        echo -n $"Starting $prog: "
        check13 || exit 1
        ulimit -n 2048
        LANG=$HTTPD_LANG daemon --pidfile=${pidfile} $httpd $OPTIONS
        RETVAL=$?
        echo
        [ $RETVAL = 0 ] && touch ${lockfile}
        return $RETVAL
}
システムをリブートした後に以下のファイル(test.php)を実行(アクセス)して、1024以上行くか確認してみてください。
<?php
$fp = array();
for ($i = 0; $i < 1500; $i++) {
    $fp[] = fopen('test.php', 'r');
}
echo '<pre>';
var_dump($fp);
echo '</pre>';
(参考にさせて頂いたサイト)
ファイルディスクリプタ数の上限変更とlimits.confの罠 (ゆめ技:ゆめみスタッフブログ)
